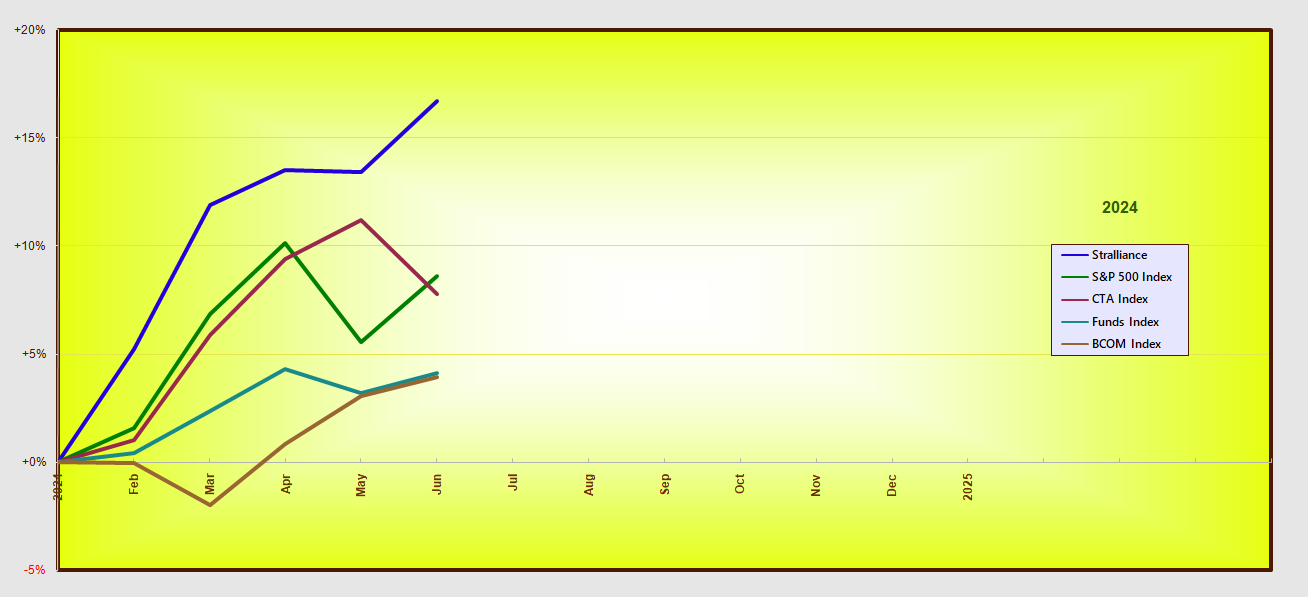
Stralliance YTD vs benchmarks, as at close of 10 Jul 2026.
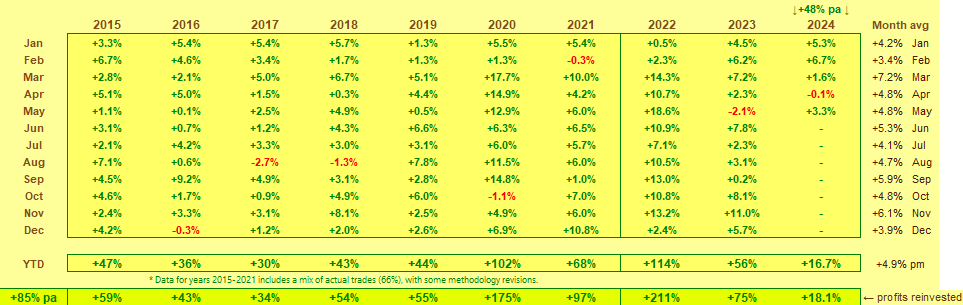
Stralliance *hypothetical monthly flat returns - trade log here.
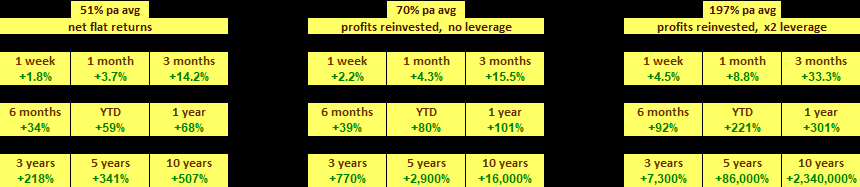
| 2026 YTD CAGR net returns | +64.8% |
| CAGR - profits reinvested net returns | +66% pa |
| 1.5x leveraged CAGR | +113% pa |
| Current DrawDown from all-time high | new high |
| Worst hist cumulative monthly DD | 0.5% |
| Worst historical cumulative daily DD | 4.1% |
| S&P 500 worst DD same period | 33.9% |
| Outperforms S&P 500 on avg | 9 out of 12 months |
| Profit to Risk ratio | 15.2 |
| MAR ratio | 16.1 |
| Sharpe ratio | 1.6 |
| Avg trade frequency | 38 trades per month |
| Trade win rate | 78.4% |
*Hypothetical performance, Stralliance & 5 core strategies vs benchmarks
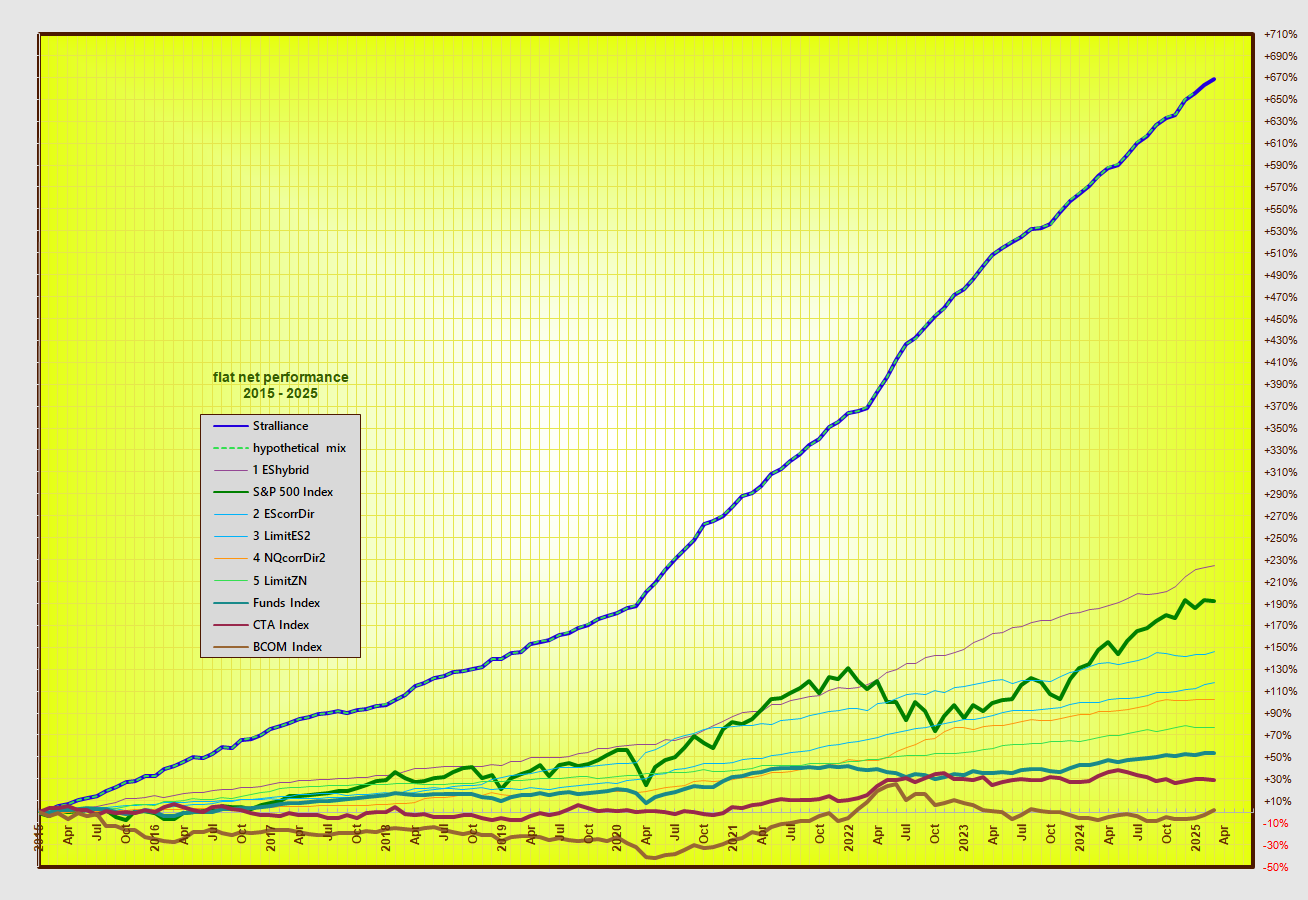
Performance
© 2015-2026 Stralliance Capital Management
| * Data from 2015 to 2024 includes a mix of actual trades (62%), with some methodology changes and trade revisions. |
| All data since 1 Jan 2025 is based solely on actual trades, with no position size or performance revisions. View trade log here. |
Past performance is not necessarily indicative of future results. The risk of loss in all types of trading can be substantial.
The presentation of information and data provided do not constitute a solicitation for investment funds, nor an offer to transact in any commodity interest or any other related financial product(s).